How to Audit Your Email Database Quality
Your email database is probably worse than you think. Most companies assume their contact data is reasonably clean because they run verification occasionally or because their bounce rates look acceptable. But a proper audit almost always reveals problems that casual observation misses.
An email database audit is not the same as running your list through a verification tool. Verification tells you which individual addresses are valid. An audit tells you about the overall health of your database: where quality problems originate, how fast your data is decaying, which segments are dragging down performance, and what systematic issues need fixing.
This framework gives you a structured approach to assessing your database quality, identifying gaps, and building an improvement plan.
Step 1: Baseline Metrics
Before you can improve anything, you need to know where you stand. Pull these numbers from your current database and recent sending history:
Total contacts. How many email addresses are in your database? Include all statuses: active, unsubscribed, bounced, suppressed. You need the full picture.
Active contacts. How many contacts are currently eligible to receive email? This means subscribed, not bounced, not suppressed. Calculate the percentage of total contacts that are active. If less than 60% of your total database is active, you have significant accumulation of dead data.
Bounce rate (last 90 days). Pull your average bounce rate across all campaigns over the last quarter. Industry standard says under 2% is acceptable and under 1% is ideal. If you are above 2%, you have a list quality problem that needs immediate attention.
Spam complaint rate (last 90 days). Gmail requires this to stay under 0.3% (and under 0.1% for high-volume senders). If you are anywhere close to 0.3%, you are in the danger zone.
Unsubscribe rate (last 90 days). Industry average is around 0.1-0.3% per send. Higher rates suggest your content is not matching subscriber expectations, or you are emailing people who did not really opt in.
Step 2: Engagement Distribution Analysis
Now look at how engagement is distributed across your database. This tells you how much of your list is actually responsive.
Engaged in last 30 days. Count contacts who opened, clicked, or replied to at least one email in the past month. This is your active core.
Engaged in last 31-90 days. These are warm contacts who are still somewhat active but trending toward disengagement.
Engaged in last 91-180 days. Contacts showing early signs of going cold.
No engagement in 180+ days. These contacts have not interacted with your emails in over six months. They are dead weight on your list and are increasing your spam trap risk (recycled spam traps activate after 6-24 months of inactivity).
Never engaged. Contacts who have never opened, clicked, or replied to any email you have sent. These could be invalid addresses, people who signed up but were never interested, or addresses from a purchased list.
In a healthy database, at least 30-40% of contacts should be engaged in the last 90 days. If your 180+ day unengaged segment is larger than your 30-day engaged segment, your database is in rough shape.
Step 3: Verification Status Breakdown
Run your entire database through an email verification service and categorize the results:
Valid. Addresses confirmed as deliverable. This should be the majority of your list. If it is below 70%, you have serious data quality problems.
Invalid. Addresses that will definitely bounce. These should already be suppressed. If you find invalid addresses in your active list, your suppression processes have gaps.
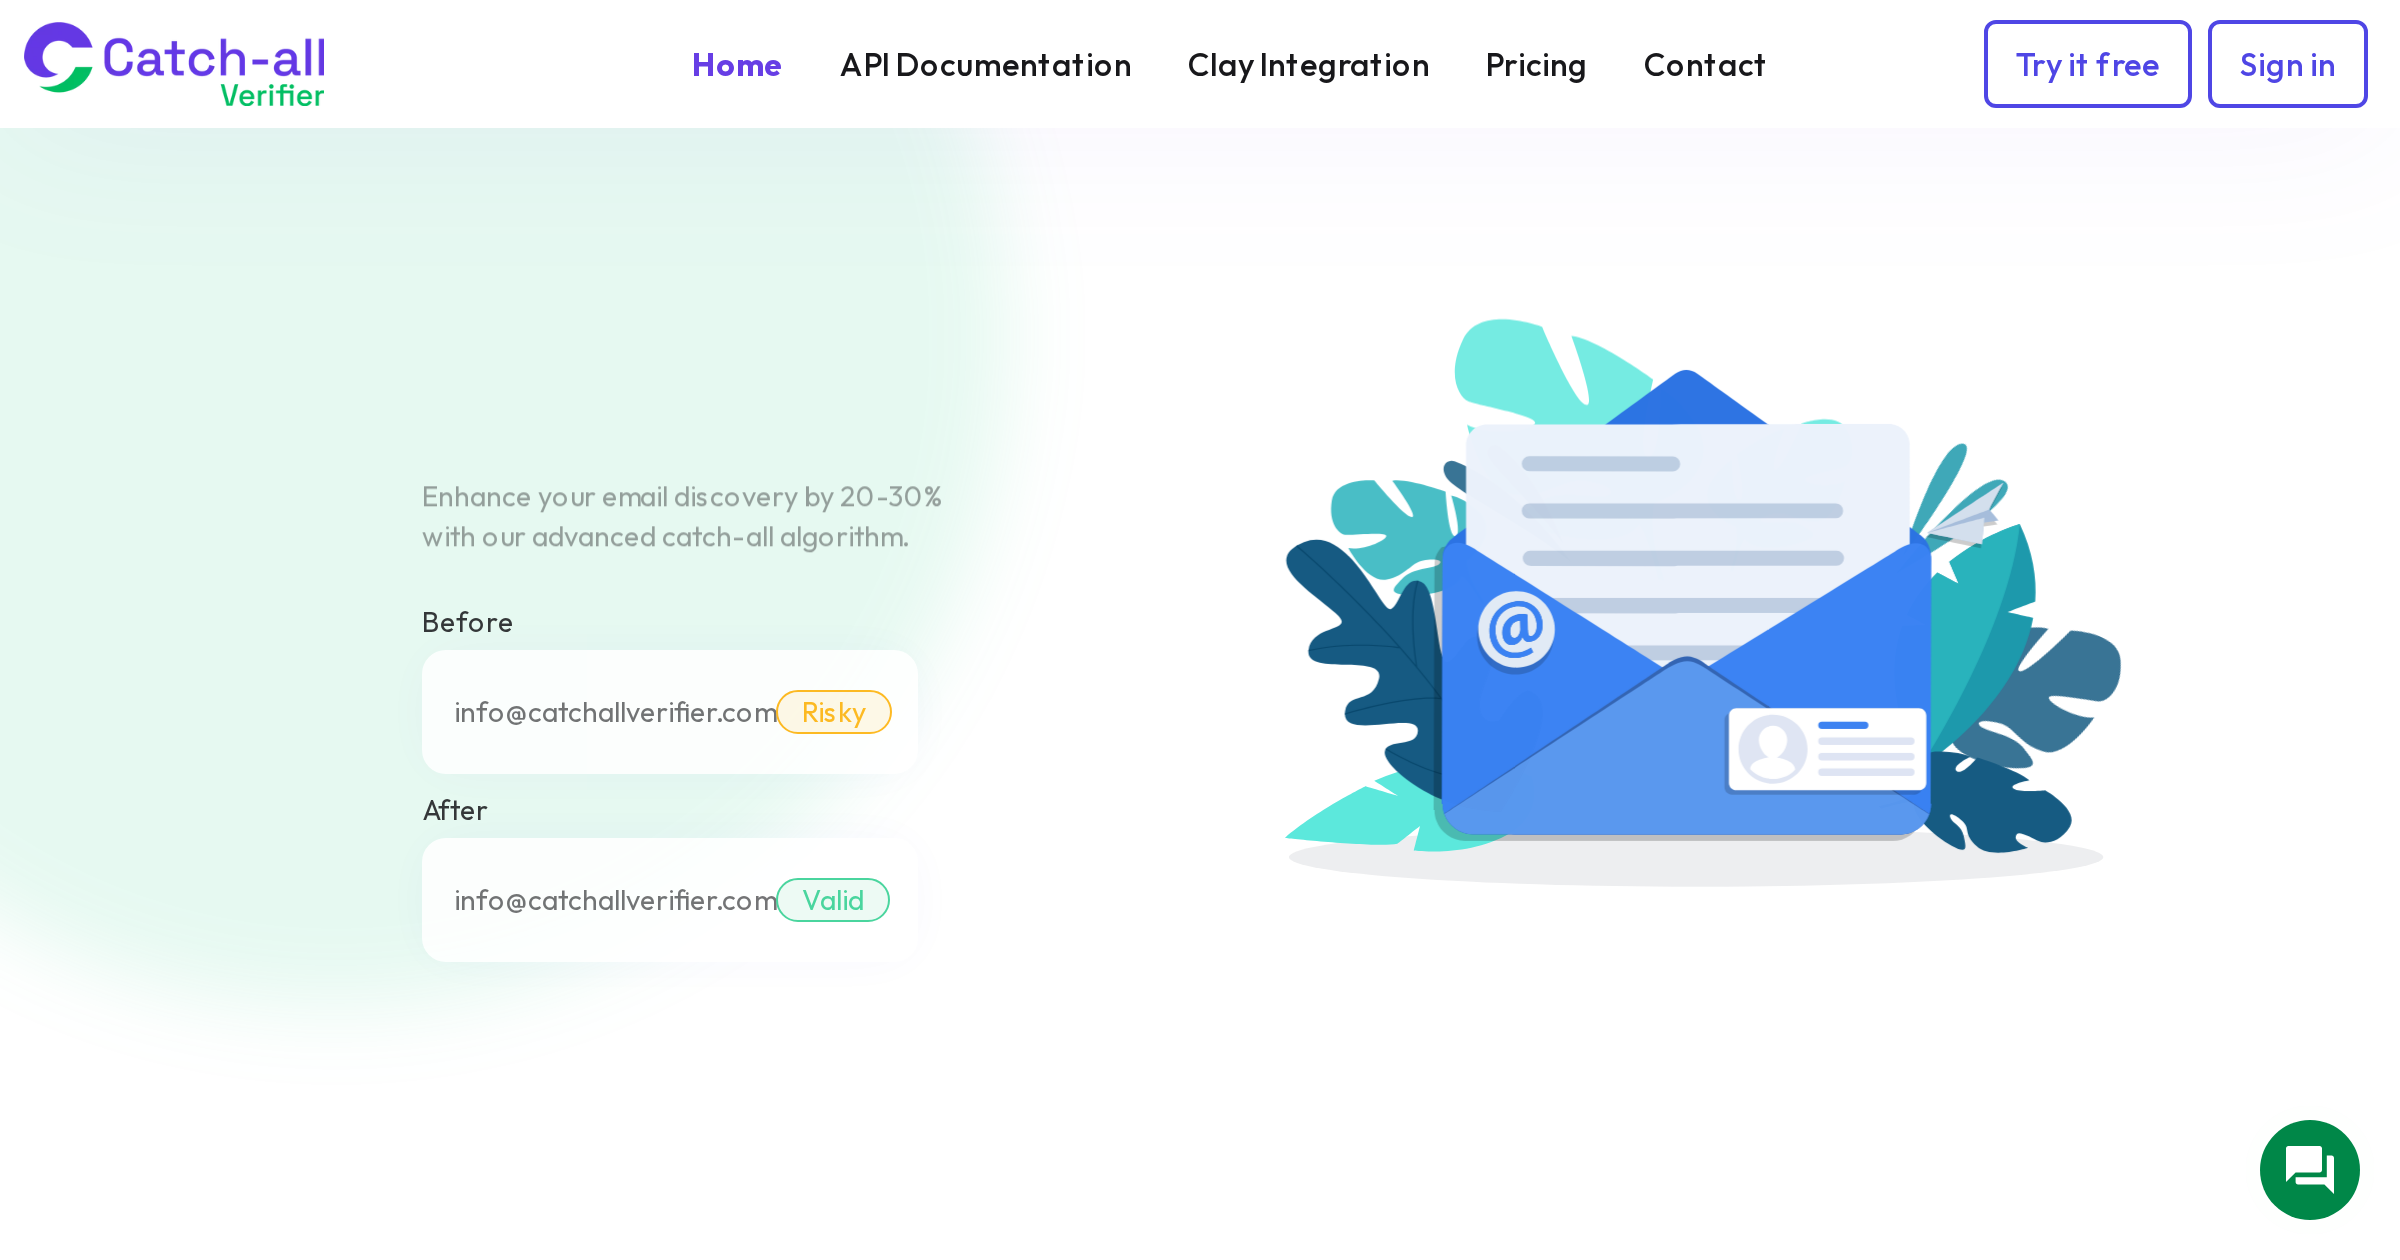
Catch-all. Addresses on domains where the server accepts all mail regardless of whether the specific mailbox exists. In B2B databases, catch-all addresses typically represent 15-40% of the total. Standard verification cannot tell you if these are real. This is where specialized tools like CatchallVerifier resolve catch-all addresses into deliverable and undeliverable, giving you clarity on this otherwise murky segment.
Risky. Addresses that returned uncertain results. The server neither confirmed nor denied the address. These carry elevated bounce risk and should be handled carefully.
Disposable. Temporary email addresses from services like Mailinator or Guerrilla Mail. These addresses may have been valid when they signed up but will expire quickly. Remove them.
Role-based. Addresses like info@, sales@, support@ that go to shared inboxes rather than individuals. These have higher complaint rates and should be flagged for special handling.
Step 4: Data Source Quality Analysis
Where your contacts came from strongly predicts their quality. Break your database down by acquisition source and compare quality metrics for each:
Website signups. Organic opt-ins from your website. These should have the highest engagement and lowest bounce rates. If they do not, your signup forms may lack verification, or you may have a bot problem.
Content downloads and lead magnets. People who gave their email in exchange for content. Quality depends on the content and whether you used double opt-in. Single opt-in content downloads often include fake addresses from people who just wanted the content and gave a throwaway email.
Event registrations. Quality varies widely. Free webinar registrations tend to include more junk addresses than paid event registrations.
Data enrichment tools. Contacts found through Apollo, ZoomInfo, Clay, or similar tools. Quality depends on the tool and how recently the data was sourced. Catch-all rates tend to be high in enriched data because many corporate domains use catch-all configurations.
Purchased lists. Usually the lowest quality source. High bounce rates, high complaint rates, and significant spam trap risk. If a large portion of your database came from purchased lists, that is likely driving your quality problems.
Manual entry and imports. Contacts added manually by sales reps, imported from spreadsheets, or migrated from old systems. Quality is unpredictable. Typos, outdated addresses, and formatting errors are common.
For each source, calculate the bounce rate, engagement rate, and complaint rate. You will likely find that one or two sources are responsible for a disproportionate share of your quality issues.
Step 5: Duplicate Analysis
Duplicate contacts waste sending credits, skew your metrics, and can make your emails look spammy when someone receives the same message twice.
Check for exact duplicates (same email appearing multiple times). Then check for near-duplicates: the same person with slightly different email formats (john.smith@company.com and johnsmith@company.com), or the same email with different capitalization (though email addresses are technically case-insensitive for the local part in practice).
Also check for Gmail-specific duplicates. Gmail ignores dots in email addresses, so john.smith@gmail.com and johnsmith@gmail.com deliver to the same inbox. Similarly, anything after a + sign is ignored (john+newsletter@gmail.com goes to john@gmail.com). If you are sending to both variations, you are double-sending to the same person.
Average CRM databases contain 10-30% duplicate records. Deduplication alone can meaningfully improve your sending efficiency and prevent annoying your contacts.
Step 6: Age Distribution Analysis
Email data decays at 22-30% per year. B2B lists decay faster due to job changes. Knowing the age distribution of your contacts tells you how much decay you are likely experiencing.
Break your database down by when each contact was added: last 3 months, 3-6 months, 6-12 months, 1-2 years, 2+ years. For each age cohort, look at engagement rates and bounce rates.
You will almost certainly find that older cohorts have lower engagement and higher bounce rates. Contacts added more than two years ago that have not engaged recently have a high probability of being invalid. At a 25% annual decay rate, roughly half of a two-year-old cohort will have become invalid.
This analysis helps you prioritize verification efforts. Re-verify your older cohorts first, because that is where the most decay has occurred.
Step 7: Domain Analysis
Look at the domain distribution across your database. Which email providers appear most frequently? What percentage of your list is on catch-all domains?
For B2B databases, you might find: 30-40% on Google Workspace domains, 25-35% on Microsoft 365, 15-25% on custom/corporate domains, and the remainder on various providers. The catch-all percentage among corporate domains can be 40% or higher.
Identify your top 20 domains by contact count. For each one, check whether it is a catch-all domain (you can do this with any verification tool). If a significant portion of your contacts are on catch-all domains, standard verification is leaving you with an incomplete picture. Those contacts are marked as "catch-all" and you have no idea which ones are real and which are not.
This is the exact use case for CatchallVerifier. Running your catch-all segment through specialized verification can turn 30% of your database from "uncertain" to "confirmed deliverable" or "confirmed undeliverable." That is a significant improvement in data quality.
Step 8: Building Your Improvement Plan
Now that you have a complete picture, build a prioritized improvement plan:
Immediate actions (this week): Suppress all invalid addresses. Remove disposable addresses. Suppress contacts with no engagement in 180+ days (or move them to a re-engagement segment). Fix any compliance issues (missing unsubscribe mechanism, etc.).
Short-term actions (this month): Deduplicate your database. Re-verify all contacts older than 6 months. Run catch-all addresses through CatchallVerifier. Set up or improve your re-engagement campaign for dormant contacts. Implement engagement-based segmentation for all future sends.
Medium-term actions (this quarter): Implement real-time verification on signup forms and lead capture pages. Set up automated verification triggers when new contacts enter your CRM. Create data quality dashboards to track metrics over time. Review and improve your data enrichment workflow to include catch-all verification. Establish a regular re-verification schedule (quarterly is a good starting point).
Ongoing practices: Monitor bounce rates and complaint rates per campaign. Review engagement distribution monthly. Re-verify your full database every 3-6 months. Audit new data sources before adding them to your database. Maintain suppression lists aggressively.
The Audit Scorecard
Create a simple scorecard to track your database health over time. Rate each of these metrics as green (healthy), yellow (needs attention), or red (urgent):
Bounce rate: Green = under 1%, Yellow = 1-2%, Red = over 2%. Spam complaint rate: Green = under 0.1%, Yellow = 0.1-0.3%, Red = over 0.3%. 90-day engagement rate: Green = over 30%, Yellow = 15-30%, Red = under 15%. Invalid address percentage: Green = under 3%, Yellow = 3-8%, Red = over 8%. Catch-all percentage (unresolved): Green = under 10%, Yellow = 10-25%, Red = over 25%. Data age (% over 1 year without re-verification): Green = under 20%, Yellow = 20-40%, Red = over 40%.
Run this scorecard monthly. Track trends over time. Share it with your team. When you can show concrete improvement in these metrics, you can demonstrate the ROI of data quality investment. And when a metric starts sliding in the wrong direction, you catch it early instead of discovering the problem when your domain reputation crashes.
A clean database is not a one-time achievement. It is an ongoing practice. But the first step is knowing exactly where you stand, and that starts with a thorough audit.